How to optimize your website for SEO with Claude
A measure-first SEO pass on two live sites: field data against Lighthouse, an HTML audit, and the fixes that cut LCP and fixed canonicals. Then what else to check on your own site.
Most SEO advice is a list of things to do. This is the other half: what to measure first, so the list turns into the three or four changes that matter on your site.
It covers one pass on two live sites, a product site and a personal career site. The order was measure, audit the HTML, fix what the readings proved, then repeat the same measurement. The numbers below are the real readings. Lighthouse numbers were retaken on the live pages for this post. The “before” values are the readings recorded when the work started.
1. Measure two ways first
There are two kinds of speed reading, and they disagree on purpose.
Field data is what real visitors’ browsers reported. It is reported at the 75th percentile (p75): three quarters of visits were at least that fast. Lab data is a simulated run, here Lighthouse 13.5 on its mobile profile, which throttles the CPU and the network. Lab is harsher than most real phones. It is repeatable, and it shows you why a page is slow.
- Field
Real visitors
- Tools
- Cloudflare Web Analytics, PostHog, the site's own recorder
- Reads
- 75th percentile of LCP, INP and CLS, per page
- Found here
- Home LCP was already good: 1924 ms at the 75th percentile over 97 views.
- Lab
A throttled phone
- Tools
- Lighthouse 13.5, mobile profile
- Reads
- LCP, blocking time and the performance score, per page
- Found here
- The slow part was the hero path and render-blocking assets.
- Source
The HTML itself
- Tools
- A script that fetches every URL
- Reads
- Title, description, canonical, robots, H1 count, JSON-LD, share image, image alt and size, hreflang
- Found here
- Canonicals without the trailing slash, and thin descriptions.
- Search
What the engines saw
- Tools
- Google Search Console, Bing Webmaster Tools
- Reads
- Impressions, clicks and queries
- Found here
- Under 100 impressions: too thin to decide anything by query.
Result One list of fixes, ordered by what a reading proved.
Field data from real visitors showed the home page already had good LCP. Lab data from a throttled phone showed the hero path and render-blocking assets were the slow part. A per-page HTML audit found canonicals without the trailing slash and thin descriptions. Search Console and Bing Webmaster Tools had under 100 impressions, too few to decide anything by query.
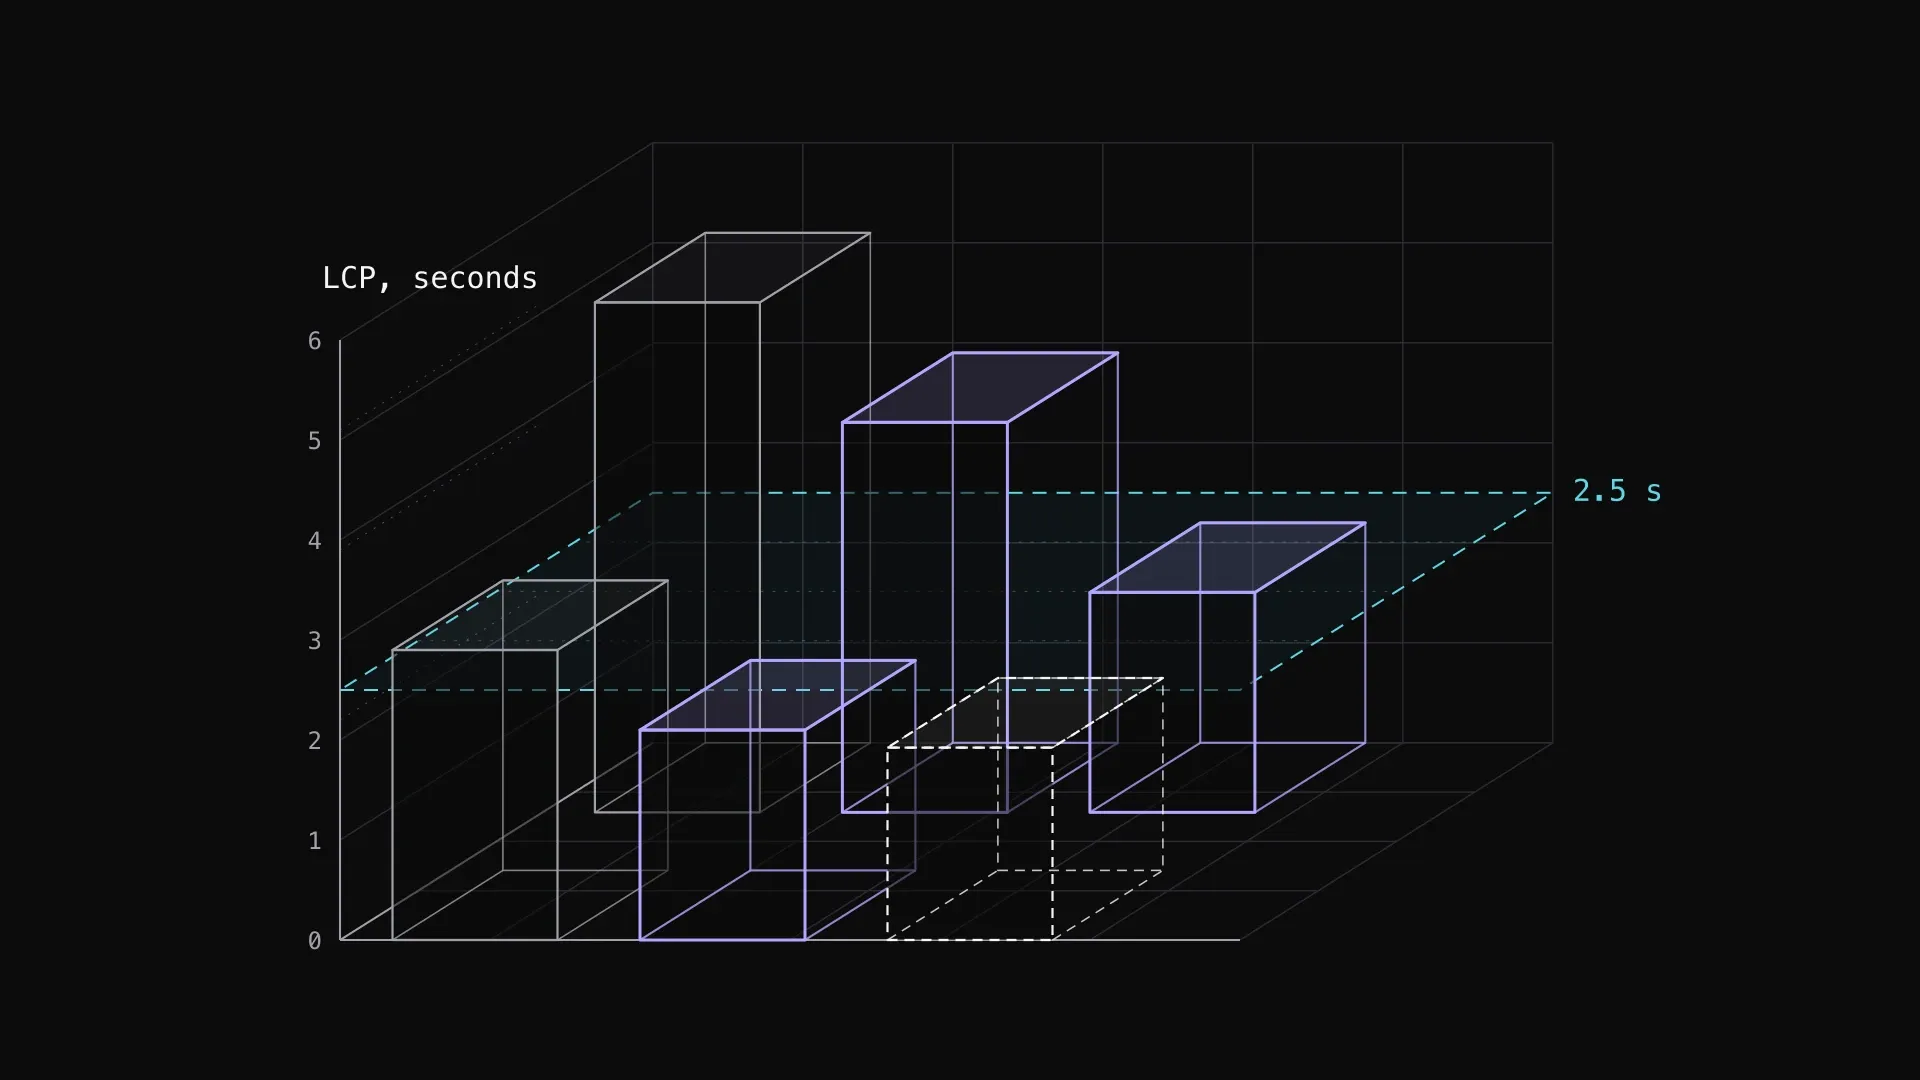
The two disagreed here. The home page’s field LCP was 1924 ms at p75 over 97 views, already under the 2.5 s line for good. The lab run on the same page read 2.9 s. Field said visitors were fine. Lab said the page was still leaving time on the table, and pointed at the hero path and at assets that block rendering. Neither reading is wrong, and a fix that only moves a lab score is worth less than one that moves both.
Search Console and Bing Webmaster Tools were read too. Both showed under 100 impressions, which is too thin to choose which pages to rewrite by query. They are worth connecting early, because they only become useful after they have collected data.
2. Audit the HTML, page by page
Speed tools do not read your markup the way a crawler does. A small script that fetches every URL and prints what a search engine sees finds the dull problems that no score flags. For each page it listed:
- title and description, and their lengths
- canonical URL and robots directives
- how many H1 headings there are
- structured data (JSON-LD)
- the share image
- each image’s alt text, dimensions and lazy loading
- language alternates (hreflang)
On the product site this found two things. The legal pages declared a canonical without the trailing slash, while the sitemap and the redirects used the slash. That tells a crawler the page lives at two addresses. And the home and blog descriptions were a short phrase, 40 and 33 characters, which gives a search result nothing to say.
A script like this takes an hour to write and gets reused on every site afterwards.
3. Fix the path to the biggest element
LCP is the time until the largest element in view is painted. On a page with a headline hero, that element is the text, so anything that delays the text delays the metric. Two changes on the product site:
- The hero text no longer waits for a script to reveal it. It paints with the first render, and the script only adds the motion afterwards.
- The animated background no longer starts at load. It starts after the page has loaded and the browser is idle.
On the career site the same idea took more steps: scripts deferred, fonts loaded without blocking, images given their real width and height, and the hero image on the blog marked as the high-priority fetch. Titles were cut to 60 characters or fewer, descriptions were made longer, and the home page got structured data describing the site and its owner.
4. Fix what search engines read
These changes do not move a speed score, and they are the cheapest ones in the list:
- Canonicals match the sitemap. One address per page, with the same trailing-slash rule everywhere.
- Each description says what the page is. A search result is a sentence long. Use it.
- Titles describe the page and fit. A blog titled only with the site’s name tells nobody anything.
- One H1 per page, and structured data that matches what the page shows.
5. The result
The same Lighthouse run, before and after:
| Page | Performance | LCP | Blocking time |
|---|---|---|---|
| Product site home, before | 80 | 2.9 s | 530 ms |
| Product site home, after | 98 | 2.1 s | 10 ms |
| Career site home, before | 49 | 5.1 s | 800 ms |
| Career site home, after | 82 | 3.9 s | 60 ms |
The SEO category read 100 on all three pages tested. The career site’s blog post reads 98 for performance and 2.2 s for LCP.
3hship home
- Lab, before2.9 s
- Lab, after2.1 s
- Field, 30 days1.924 s
career site home
- Lab, before5.1 s
- Lab, after3.9 s
career site blog post
- Lab, after2.2 s
- Before
- After
- Real visitors (75th percentile)
- Good threshold
The product site's home LCP in the lab fell from 2.9 s to 2.1 s, under the 2.5 s line, and its real-visitor p75 was already 1.924 s. The career site's home fell from 5.1 s to 3.9 s and is still over the line. A career site blog post reads 2.2 s, under it.
The product site’s home now crosses the line in the lab as well as in the field. The career site’s home improved by 1.2 s and still sits above 2.5 s, which is the preloader item in the next section.
6. What else you should be aware of
A first pass fixes what a tool can see. Below is what to check next on your own site, what it does for rankings, and what to do about it. The first group moves rankings by what practitioners keep reporting, so read it as guidance, not as a measurement from these two sites. The second group is what these two sites ran into. The third is worth discounting.
Check next
- Internal linking. Every page should be reachable from another in a few clicks, with link text that says what it points to. It is the most common leftover on small sites, and a crawl of your own pages shows it.
- Structured data beyond the home page. Add article and breadcrumb data to posts, and check it against what is on the page. Markup that describes content the visitor cannot see is a risk, not a help.
- Image formats and sizes. Modern formats and responsive sizes shrink the largest element on image-led pages, which is the LCP element there. Check what your biggest image weighs on a phone.
- Interaction latency (INP). It is the third Core Web Vital, how long a page takes to respond to a tap. On the product site the real-visitor value was good, 56 ms at p75. Read it for your own interactive pages.
- Backlinks. Links from other sites that you did not write are still the strongest signal, and no on-page work substitutes for them. Earn them by publishing something worth linking to.
- Content freshness. Update pages that answer a question that changes, and say when. Do not re-date pages that did not change.
Watch for on your own site
- A script your CDN injects. Here the CDN added an inline bot-detection script, the content security policy refused it, and the browser logged one console error per page. The score did not move, but the noise hides real errors. Open the console on a live page, then allow the script by hash or turn the feature off.
- A preloader over the page. On the career site a letter animation covers the home page for about 2 s, and LCP cannot finish while it does. Shorten it, skip it on return visits, or drop it. It is a design choice, not a tuning one.
- Search data that is too small. Both consoles showed under 100 impressions here, too few to choose pages by query. Connect them early, because they only become useful after they have collected data.
Overrated or unproven
- Crawl budget. It matters for sites with a very large number of URLs. A site of this size can ignore it.
- A file for language models. Several practitioners report no measurable effect from adding one. Treat it as unproven until a search engine says otherwise.
7. Repeat it
- Read the field first. Take p75 for LCP, INP and CLS per page. If a page is already good, a lab fix is lower priority.
- Run the lab on the live URL. Use the mobile profile, one run per page, and keep the output.
- Crawl your own HTML. Titles, descriptions, canonicals, H1s, structured data, share image, image attributes.
- Fix what a reading proved. Start with whatever delays the largest element, then the dull markup problems.
- Run the same measurement again. Same tool, same profile, same page. Record both.
- Write down what you left. Anything you chose not to fix, with the reason, is where the next pass starts.
npx lighthouse https://example.com/ --only-categories=performance,seo \ --output=json --output-path=./example.json --chrome-flags="--headless=new"Verdict
The measuring changed what got fixed. Field data showed the product site’s visitors were already fast, so the work went to the hero path and to the markup problems no speed score flags. The product site’s lab LCP fell from 2.9 s to 2.1 s and its performance score rose from 80 to 98. The career site’s fell from 5.1 s to 3.9 s and 49 to 82, and still has a preloader to decide about. “What else you should be aware of” is the list to take to your own site for the next pass.
Responses
Keep reading
Claude Code usage limits: what burns your quota and how to stretch it
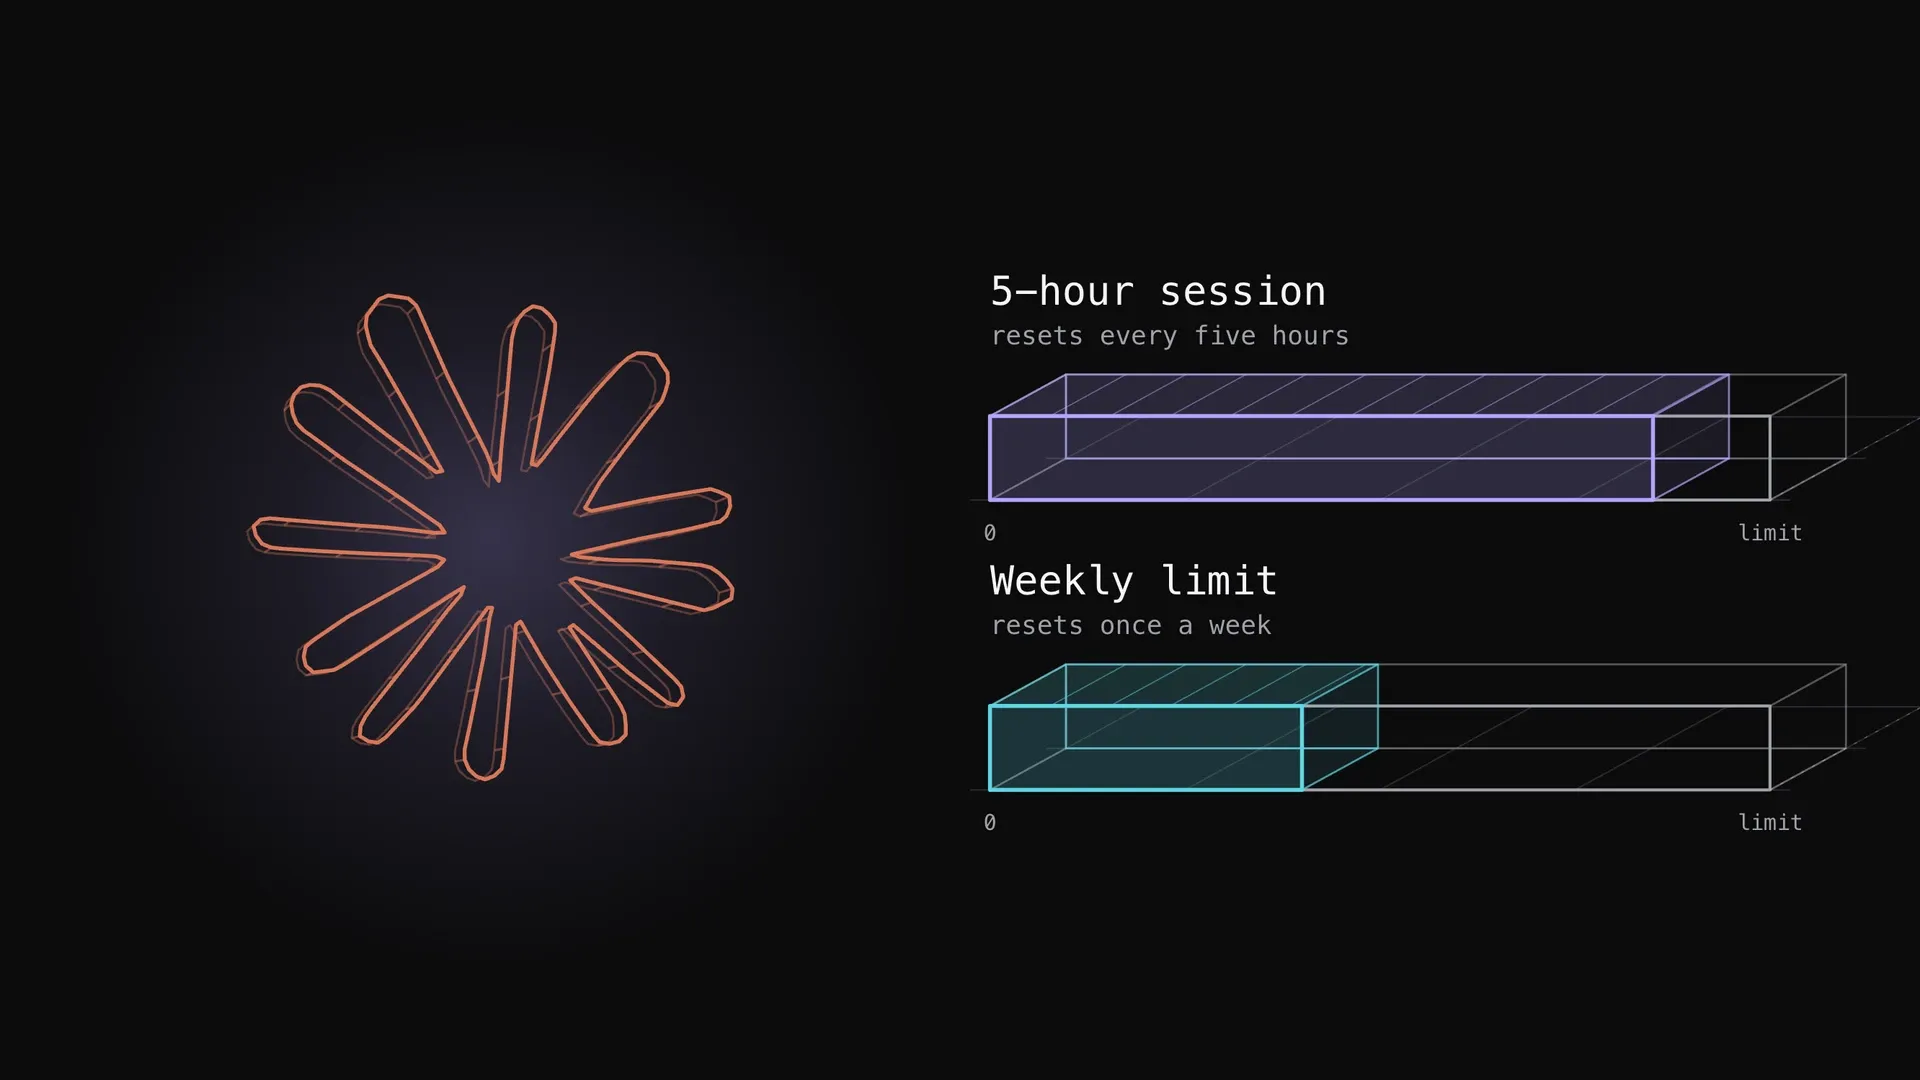
What the Claude Code five-hour and weekly limits are, how they show up, what spends them fastest (long context, large tool output, parallel agents, model choice, retries) and the documented ways to stretch them, with one measured plan week.
How to pace your Claude subscription to survive the week
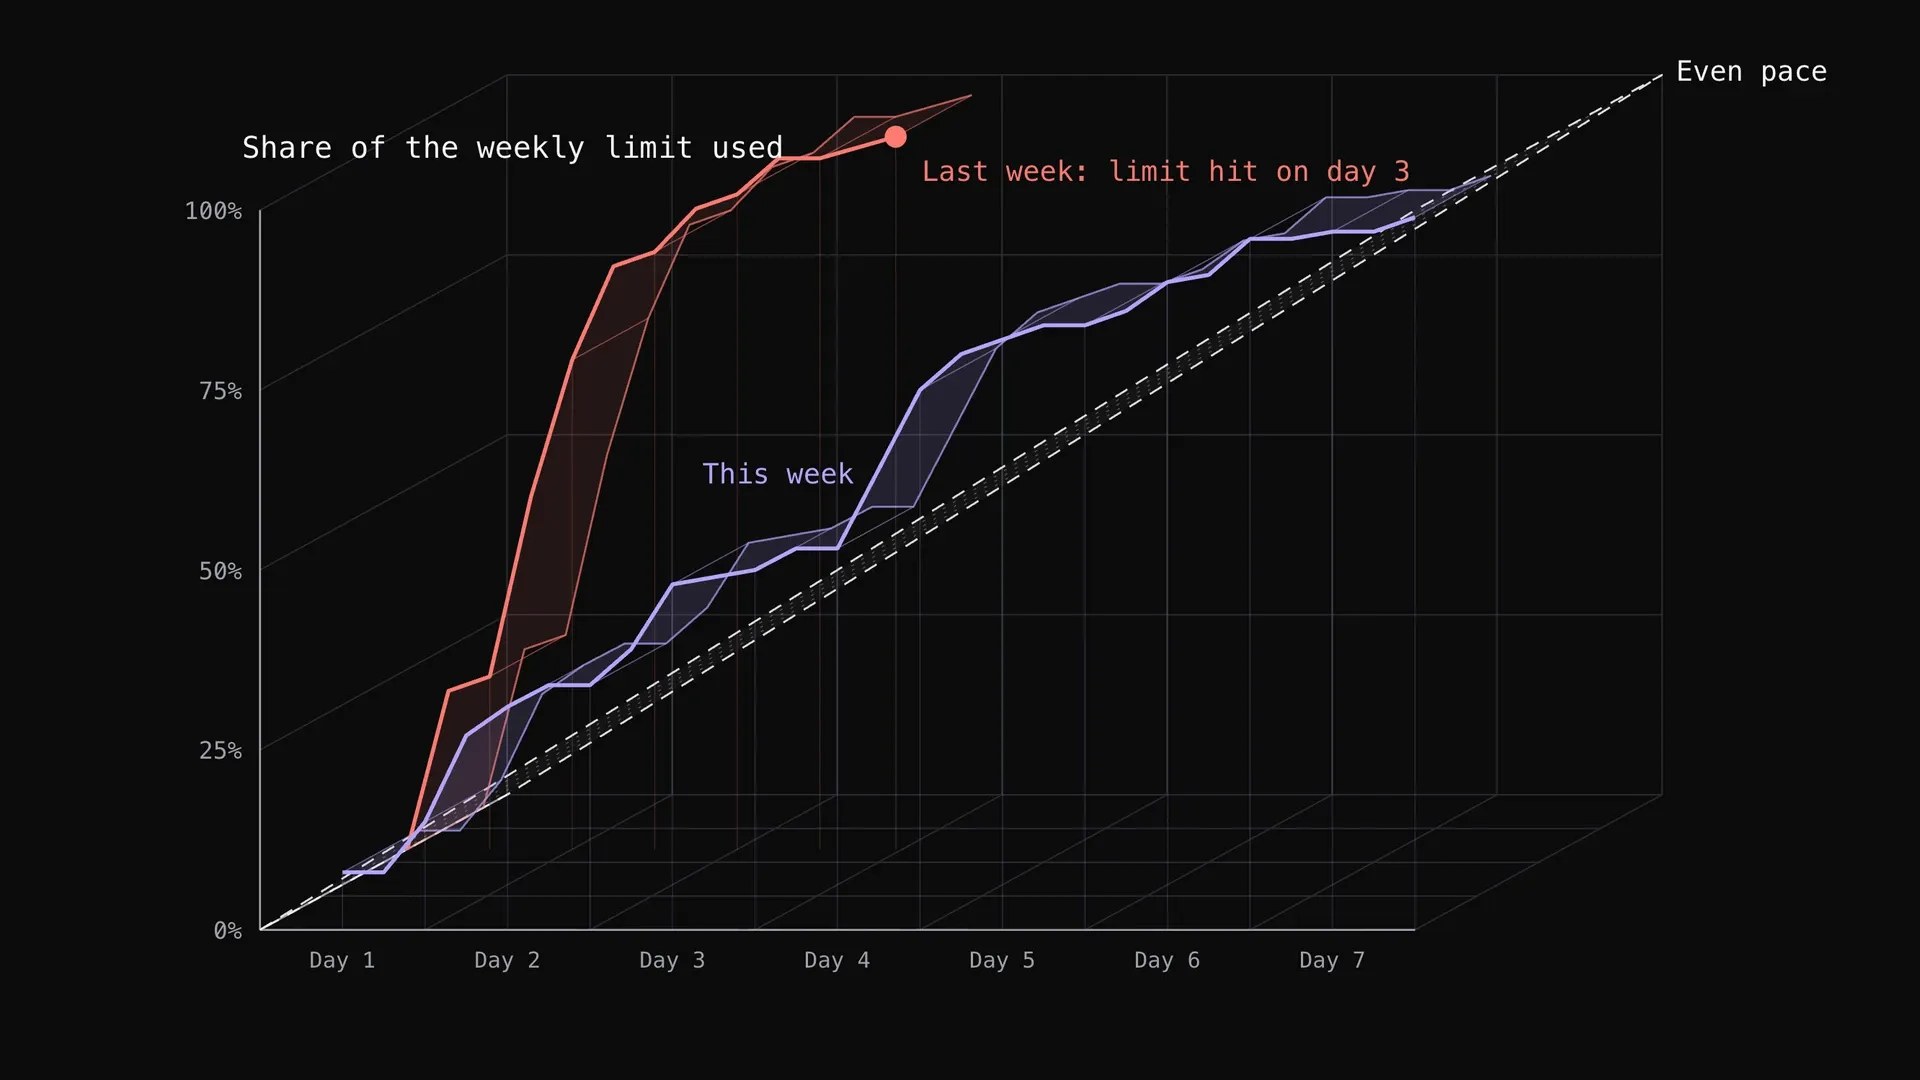
My Claude weekly limit ran out on day 3 one week and lasted all seven days the next. What changed: a simple wait rule for the strongest model, and the cheaper model doing more of the work, with the real usage charts.

Creating my logo with Opus 5.5
Eighteen versions of the 3h mark, made with Opus 5.5. The first twelve were drawn by eye against a reference. The last six were built from a grid and scored against a traced outline of it. The final mark is v17.