How to pace your Claude subscription to survive the week
My Claude weekly limit ran out on day 3 one week and lasted all seven days the next. What changed: a simple wait rule for the strongest model, and the cheaper model doing more of the work, with the real usage charts.
The short answer
- Spend a Claude weekly limit evenly: one seventh a day. Spend it as work arrives and it runs out mid-week.
- Last week mine ran out on day 3. This week it lasted all seven days.
- Two changes came in together: new work for the strongest model, Opus 5.5, waits when usage runs ahead, and the cheaper model, Sonnet 5.5, does more of the work.
- Both are easy to copy. The four steps are at the end.
1. Last week the limit ran out on day 3
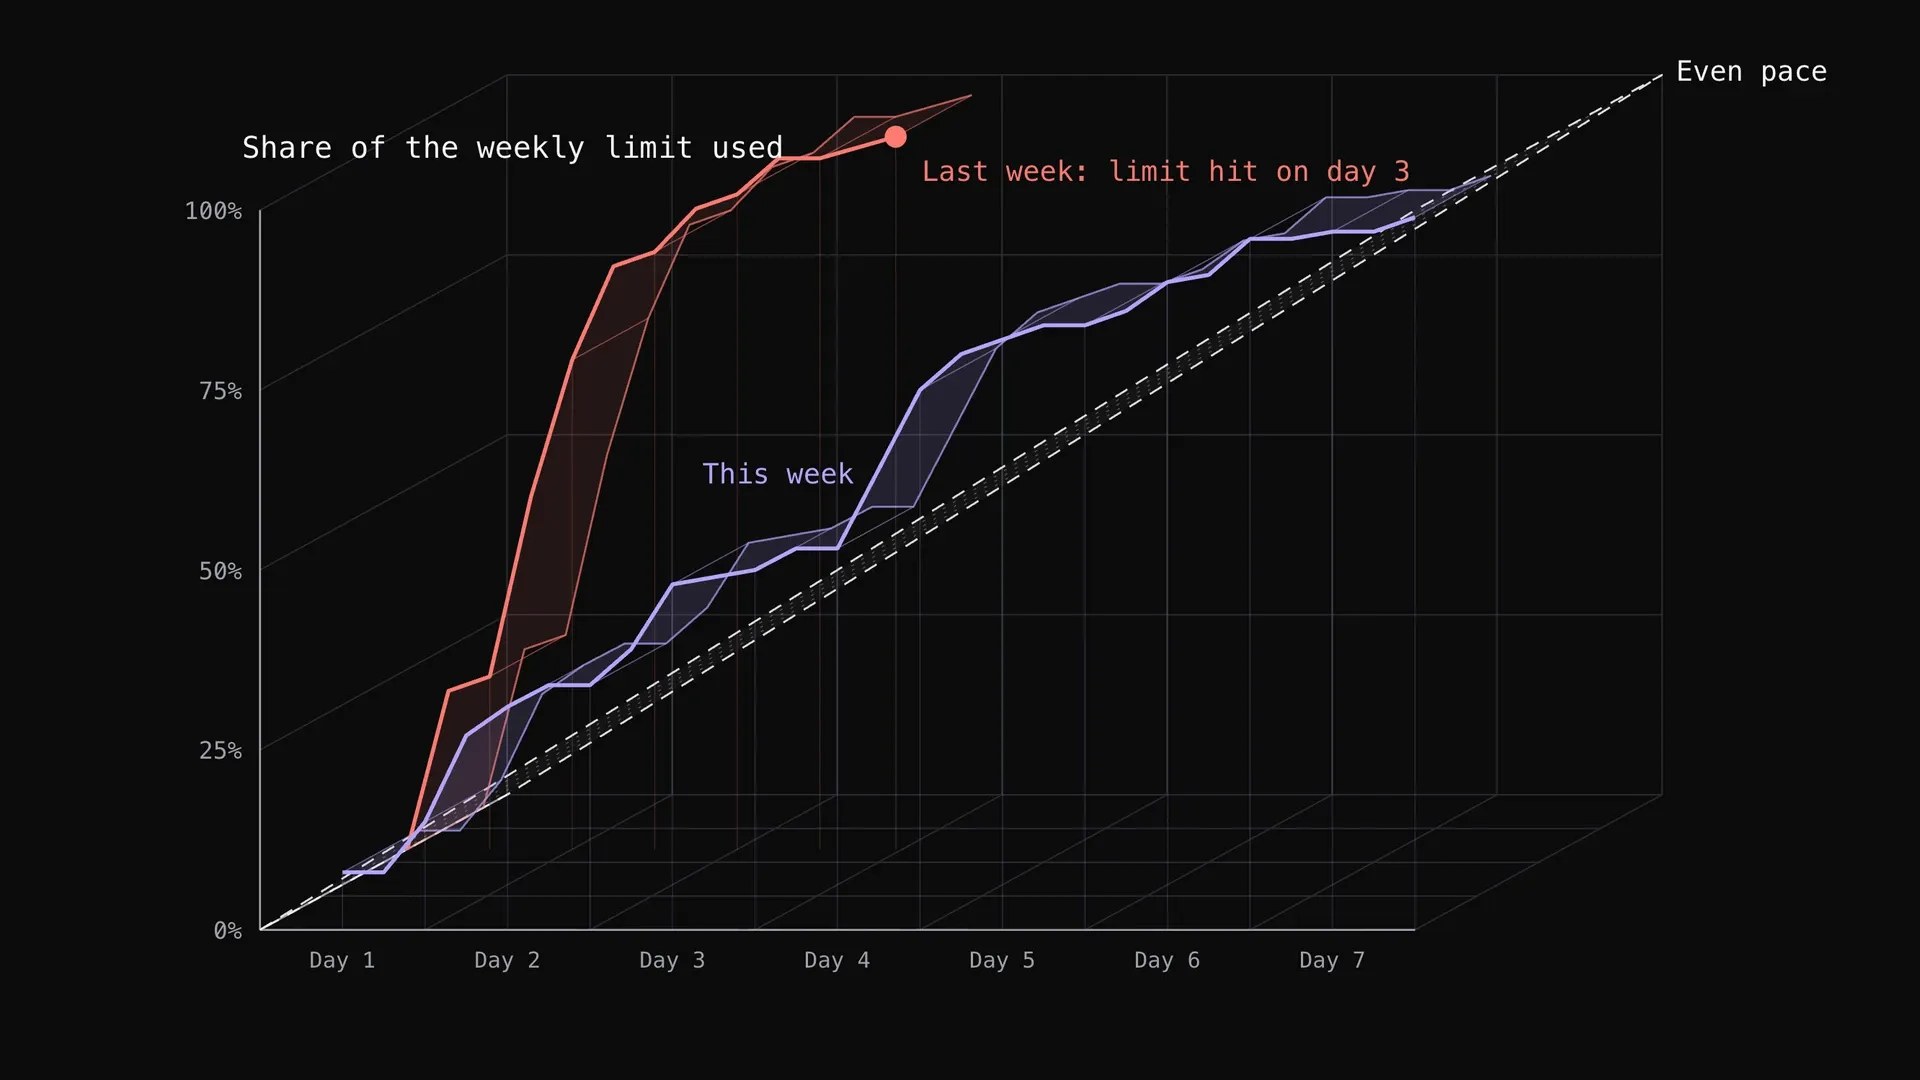
A Claude 20x plan has one weekly limit that resets at the same hour every week, and a meter shows how much you have used. An even pace is one seventh a day, about 14.3 points.
Last week I used 68 percent on day 1 and hit the limit about 70 hours in. Nothing was left for the last four days.
Share of your weekly limit used
Days since the weekly limit last reset
This week's line starts at its first reading, about 12 hours in.
Last week, no pace rule
Ran out on day 3
68% gone after day 1
This week, with the pace rule
Lasted all 7 days
15% used after day 1
See the numbers as a table
| End of | Last week | This week | Even pace |
|---|---|---|---|
| Day 1 | 68% | 15% | 14% |
| Day 2 | 91% | 34% | 29% |
| Day 3 | 99% | 50% | 43% |
| Day 4 | limit reached | 75% | 57% |
| Day 5 | limit reached | 84% | 71% |
| Day 6 | limit reached | 96% | 86% |
| Day 7 | limit reached | 99% | 100% |
This week it lasted all seven days. These are two different weeks with different work, and I made two changes at once, so I cannot say how much each one did.
2. Change one: make the strongest model wait
Opus 5.5 is the strongest Claude model, and the one I leaned on most. Before a new Opus session starts, a script checks the meter. The new work waits when:
- usage is more than 5 points ahead of an even pace,
- the shorter 5-hour limit is at or above 90 percent, or
- the current rate of use, if kept up, would empty the week early.
Never held: Sonnet sessions, restarts of a session that already exists, and anything I type myself.
New Opus work waits New work starts as normal. In total, 115 of the 168 hours were "wait".
This is a replay of the stored meter, not a log of real holds. It shows how often the rule would speak up: 115 of the 168 hours. A wait only delays work, so change two is what kept work moving.
3. Change two: let the cheaper model do more
Sonnet 5.5 is the cheaper model. Six main sessions moved to Sonnet through a restart on day 5, and a written default now keeps Opus for work marked hard.
Last week 98.5% of the cost was Opus
This week 45.5% of the cost was Opus
Opus 5.5, the costly model Sonnet 5.5, the cheaper one Others
See the numbers as a table
| Opus | Sonnet | Others | Tokens written | |
|---|---|---|---|---|
| Last week | $1,664 | $0 | $25 | 22.5 million |
| This week | $1,166 | $1,348 | $48 | 53.6 million |
Last week Opus did 98.5 percent of the work by cost. This week Sonnet did 52.6 percent and Opus 45.5. The models also wrote 53.6 million tokens this week against 22.5 million last week (a token is about three-quarters of a word), and the limit still lasted. Dollar figures are public price lists, not charges on the plan.
Did the cheaper model make the work worse? I compared how well jobs came back when Opus led the main session and when Sonnet did.
Came back as a success
Led by Opus78.6% (302 of 384)
Led by Sonnet85.7% (108 of 126)
Had to be redone
Led by Opus11.7% (45 of 384)
Led by Sonnet6.3% (8 of 126)
Not statistically significant; most of the Sonnet-led packets came from one channel.
Sonnet-led sessions did at least as well, 85.7 percent success against 78.6. That gap is not statistically significant, one project supplied most of the Sonnet-led jobs, and the groups did not get the same work. It supports one narrow thing: nothing says the cheaper model made things worse.
4. What ate the budget
My first guess was a mistake, such as a runaway loop. I priced the sessions of both weeks and found none. Only 6.9 percent of this week and 7.1 percent of the week before counted as avoidable.
The biggest single item was context compaction, when a long chat is summarized to fit: about 17.8 percent of the week, up from 5.4 percent. I did not measure whether that was avoidable.
I also replayed the earlier week with cheaper settings per call. The best set saved 5.9 percent and stretched that week to 3.10 days, far less than pacing did. So I changed when work runs, not how each call is made.
5. Copy it in four steps
- Find your meter. Note the weekly percent every day. Without a record there is nothing to pace against.
- Draw the even line. One seventh of the limit a day, 14.3 points. Compare the meter to it each morning.
- Make the strongest model wait. If you are more than 5 points ahead, hold new work for the strongest model, and let the cheaper one carry on.
- Make the strongest model a choice. Start on the cheaper model, and move up only for work you have marked hard.
Responses
Keep reading
Claude Code usage limits: what burns your quota and how to stretch it
What the Claude Code five-hour and weekly limits are, how they show up, what spends them fastest (long context, large tool output, parallel agents, model choice, retries) and the documented ways to stretch them, with one measured plan week.

How to optimize your website for SEO with Claude
A measure-first SEO pass on two live sites: field data against Lighthouse, an HTML audit, and the fixes that cut LCP and fixed canonicals. Then what else to check on your own site.
Evaluating local models on one 12 GB GPU
Five local models tested on one RTX 4070 (12 GB) with LM Studio and llama.cpp: Qwen3-VL-8B, Gemma 4 12B QAT, Gemma 4 26B A4B, Qwen3.8-27B and Qwen3.6-35B-A3B.